Sunday 13 April 2014

Do you want to grow your money to as high as 36% to 40% annually?

Growing money means we are talking about serious business and I'm looking for individuals who can invest 5  to 20 Lakh rupees per year so that I can trade on your behalf and get a return on investment worth 36% to 40% per year

If you had browsed through my articles, you can find that I'm an Elliott Wave enthusiast and I combine it with few key technical indicators to forecast stock movement

As people say it is easy to forecast the move but to trade is very difficult. Over a period of few years I have to an extent cracked the movement of stocks and can fairly make money consistently

If you are interested to grow your money and want to invest in stock market then let us partner. You fund the approach and I execute it for you. The deal is as simple and candid as that through which I get to take a % cut out of the profits generated

This post won't end without mentioning about losses. As you know, stock markets don't guarantee a return always, and I respect that and make sure the loss incurred is not more than 10% of your capital invested, in fact I focus to keep it lesser than that

For anyone who is interested to work with me on this venture, please feel free to reach out to me at researchstockmarket@gmail.com 

Saturday 7 December 2013

Just Dial - Long Term Elliott Wave Analysis - Dec 7th '13

Just Dial stock opened up for trading in the month of Jun ‘13 and from thereon it has been seeing new highs month over month. We will be looking at the long term chart for it from a weekly movement perspective and then perform the analysis basis EWP to see the movement it could possibly make in future
The methodology I usually follow is to completely understand the history of movement in a particular stock and then from there try to project the future movements using EWP combined with few other technical indicators
The most prominent tools and indicators that I use to understand support and resistance levels are Fibonacci Retracement & Extension levels, Gann Fan, Super Trend, Ichimoku & Simple Averages (30, 50, 100, 150 & 200 days), divergence on stochastic & pivot points
Trading can be made relatively easy and predictable once we get the long term count. Getting the big picture and the direction of the wave count is very important before narrowing down to the trading opportunity
Usually I take the monthly/weekly chart and track the long term trend and then move to daily & hourly charts to look for trading opportunities. While the above method does not  guarantee 100% trading profit, it focuses on having your losses always under your overall profits so that net-net your overall portfolio gives a positive growth

Daily Chart

The above chart clearly shows that the first 5 wave move is completely over and a correction is undergoing currently. If there is an up move it will not retrace beyond 61.8% to a high of 1320 and from thereon the final correction may take it to 1000 levels

Weekly Chart

While the first 5 movements have completed it is just now part of a bigger wave “1” and now the correction for wave “2” is underway. Once it gets over around 800 to 1000 level it should resume the major break out wave which may take it close to 2750 to 2800 levels as given below

We can review the long term chart again next year mid way to see the direction and then accordingly make wave adjustments to the long term view
Summary – If you are planning to buy then hold your urge and allow the fall to complete in next 3 months or so and enter next year at around 900 to 1000 level. For traders/investors who are already holding it around 700 to 1200 levels wait for a move up to 1320 or so and then use that opportunity to book profit
If anyone has already bought at a high of 1400 level then you have two options, if you cannot hold beyond 3 months then use the next up move to 1300 to exit in loss. If your investment view is more than 1 to 2 year time frame, then accumulate this stock at around 1000 level to lower your buy price average and see it moving to 2700 levels in next 18 months to 2 years

Sunday 18 August 2013

Bank Nifty (NSE) - Irregular Correction - Elliott Wave Analysis - Aug 18th '13

According to Elliott wave principle, if an irregular correction appears then the wave c will be deeply bearish and will make a low which is lower than wave a

This indicates that Bank Nifty will be leading the bearish race and will be more responsible for Nifty drifting further down to 5200 or even 4400 levels

I have outlined charts of all 3 main time frames i.e. daily, weekly and monthly to depict the wave movements in the best possible manner

Monthly chart

As shown below in the chart we see that Bank Nifty has formed an irregular correction with wave b going beyond wave a which signifies that wave c will have a steep downmove.


                                                        Weekly chart


      Avoid going long on banking stocks which constitute Bank                                                                Nifty. Don't add banks to your portfolio. Even if you want to                                                           go long from an investment point of view for next 5 years then       this is not the right time as we will see all major banks making       new year's low


 Summary

In the next 10 to 12 months time frame, we may see the                                                                 following levels very likely

Axis Bank - may go down to 700 levels and breaking that can get to 500 level
 SBI - may go down to 1100 to 1300 level
ICICI - may go down to 600 to 625 level, dropping that level could                                                       get down to 450 as well
HDFC Bank - may go down to an intermediate level of 510, breaking that can see 400 eventually

Monday 12 August 2013

Sunpharma (NSE) - Elliott Wave Analysis - Aug 12th '13

Sunpharma has been on a steady move upwards since 1996, it has taken 17 years to complete the entire wave movement from 1 till 3. Wave 3 was an extended wave which ended just above the 300% mark of wave 1.

I have outlined analysis primarily keeping in mind Elliott wave movements and then mapping with other technical indicators

Weekly Chart

Chart below gives a complete picture of the overall wave movements that has occurred in the past and with that we can say Sunpharma is due for a correction

Uusally if the wave 2 retraces by 23.6% or 38.2% then more or less we can expect an extended 3rd wave of 300% and that is exactly what happened with Sunpharma as well. Below chart shows the wave 2 retracement

 Wave 3 ended at 581 level slightly above the 300% mark


Since wave 2 was very brief we can expect wave 4 to be for a slightly elongated period, atleast more than the wave 2 formation timelines. Also first level of support in weekly chart is around 465 levels and breaking    that the final support is at around 385 levels. Sunpharma should hold on to it and move back to march its journey to complete wave 5

I have computed the wave 5 movement assuming that wave 4 will end  around 385 levels, we can see that post a correction Sunpharma may move to 610 to 620 levels in a year's time or so 


Usually market reacts to the fibonacci numbers appropriately, esp. to mention about the number 89. We can see from weekly charts that Sunpharma has touched the fibonacci number line of 89. This indicates that the stock will see some adverse movement. Now comparing with the following information with our Elliott wave analysis we can say that the adverse action will be definitely seen on the downside to complete wave 4 correction

Monthly chart shows the time it may take to complete the wave correction and march its juorney toward 5th wave


Other indicators like stochastics and ATR also point a correction. ATR is at an all time high and may correct basis price movement. Likewise Stochastics has shown negative divergence and is in over bought zone which indicate that a downward movement is due any time


Gann fan helps us to find the support and resistance levels

Summary

Short Sunpharma futures keeping in mind a 2 to 3 month timeline and     keep SL at previously made high of 581. Aim for a target of 465 and     then if it falls further next levels support is around 385

Once you see those levels wind your shorts and go long until 600 levels

If you have any questions on any of the stocks you hold and want to       know a near/long term perspective then please do write to me at             researchstockmarket@gmail.com. Will get back to you as soon as I can


Sunday 11 August 2013

Divislab (NSE) - Elliott Wave Analysis - Aug 11th '13

Divislab retraced by 50% from the previous made high of 1234.4 and made a recent low of 905.25. It is about a 26% down move in price. I'll be providing a technical view of the stock price by majorly looking at the Elliott wave movement which details out a study basis market psychology

Weekly Chart

We could see that the starting point of the wave was sometime back in 2009 and the wave is still on to complete its final 5th wave

Immediate resistance for Divislab according to weekly chart is at 1100 level as shown by Supertrend indicator


 In the below given chart we can clearly see that the wave 3 touched close to 1260 levels which is 161.8% of the wave 1 upmove


Wave 4 retraced by 50% by connecting wave 3 and wave 2 as shown below in the chart


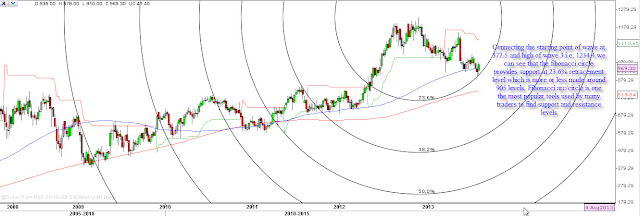
Those levels of support are also seen by the use of other tools like Gann fan and Fibonacci circle


Usually stocks will see up move when they stand closer to the nearest fibonacci number in the below given chart there is high possibility of that happening as the fibonacci number 89 is nearing


Extension of wave 5 computed with the help of fibonacci extension tool by connecting the starting point of wave all the way up to high of wave 3 and wave 4 low. We can see that 50% extension level is at 1330 level and Divislab may see those levels in a year or two time frame


You can reach me at researchstockmarket@gmail.com, if you have questions or help required in building your portfolio