Divislab retraced by 50% from the previous made high of 1234.4 and made a recent low of 905.25. It is about a 26% down move in price. I'll be providing a technical view of the stock price by majorly looking at the Elliott wave movement which details out a study basis market psychology


You can reach me at researchstockmarket@gmail.com, if you have questions or help required in building your portfolio
Weekly Chart
We could see that the starting point of the wave was sometime back in 2009 and the wave is still on to complete its final 5th wave
Immediate resistance for Divislab according to weekly chart is at 1100 level as shown by Supertrend indicator

In the below given chart we can clearly see that the wave 3 touched close to 1260 levels which is 161.8% of the wave 1 upmove

Wave 4 retraced by 50% by connecting wave 3 and wave 2 as shown below in the chart

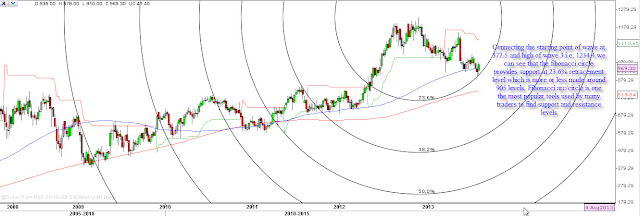
Those levels of support are also seen by the use of other tools like Gann fan and Fibonacci circle


Usually stocks will see up move when they stand closer to the nearest fibonacci number in the below given chart there is high possibility of that happening as the fibonacci number 89 is nearing

Extension of wave 5 computed with the help of fibonacci extension tool by connecting the starting point of wave all the way up to high of wave 3 and wave 4 low. We can see that 50% extension level is at 1330 level and Divislab may see those levels in a year or two time frame

You can reach me at researchstockmarket@gmail.com, if you have questions or help required in building your portfolio
No comments:
Post a Comment